
TerraVisuals — Project Report · Nairobi, Kenya
Deforestation & carbon stock assessment of the Mau Forest Complex
A satellite-based analysis of tree cover loss, carbon-stock change and climate implications — built on an automated Google Earth Engine workflow designed for national replication.
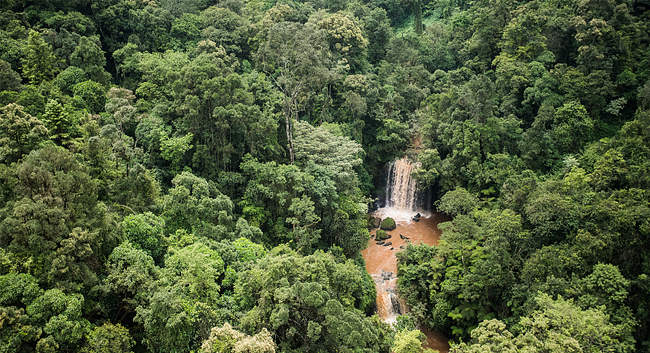
Mau Forest Complex, Kenya
Executive summary
Between 2001 and 2024 the Mau Forest Complex lost approximately 41,780 hectares of tree cover. Using satellite-derived biomass datasets, TerraVisuals estimated a net loss of about 0.38 Mt of above-ground carbon between 2007 and 2022 — equivalent to 1.39 Mt of CO₂. The analysis maps spatial deforestation hotspots suitable for restoration prioritization on a workflow replicable across any forest landscape.
Carbon years available
2007 · 2010 · 2015 · 2016 · 2017 · 2018 · 2019 · 2020 · 2021 · 2022
Results, year by year
Annual tree cover loss (ha) — Hansen/UMD, clipped to the complex boundary.
Loss peaked in 2002 (5,536 ha) with a sustained high period through 2010, declined markedly in 2020–2022 (as low as 97 ha in 2021), then increased again in 2023–2024.
Method
- 01 — Area of interest. The Mau Forest Complex boundary is assembled from WDPA protected-area blocks and dissolved into a single analysis polygon.
- 02 — Deforestation. Annual tree cover loss is extracted from the Hansen/UMD Global Forest Change product, clipped to the AOI and converted from pixel counts to hectares.
- 03 — Carbon. Above-ground biomass is read from ESA CCI Biomass for each available epoch and converted to carbon stock (Mt C) using the standard 0.47 carbon fraction.
- 04 — Statistics. Loss and carbon series are joined by year, cumulative loss is computed, and carbon stock change is converted to CO₂-equivalent using the 44/12 molecular ratio.
Why it matters
The Mau Forest Complex is the largest of Kenya’s five water towers, feeding the Mara, Sondu, Njoro and Ewaso Ng’iro river systems. Losing canopy here does not just release carbon — it reduces dry-season river flow, increases erosion into Lake Victoria and the Mara ecosystem, and undermines the tea, livestock and tourism economies downstream.
Quantifying loss and carbon in the same frame lets conservation agencies, counties and carbon-project developers argue for interventions with evidence rather than anecdote — and to measure whether restoration is actually working.
Interactive map: the dark outline is the forest complex boundary; the shaded patches are detected tree-cover loss areas. Click any patch for its attributes, and zoom in to inspect loss at block level.
Sources: Hansen/UMD Global Forest Change, ESA CCI Biomass, Kenya Forest Service, UNEP. Analysis and visualisation by Eng. Kimeu Derick, TerraVisuals.
Map atlas
Every analytical layer produced for the study, switchable below. Hover any map to magnify it and inspect detail at block level.
 Hover to magnify
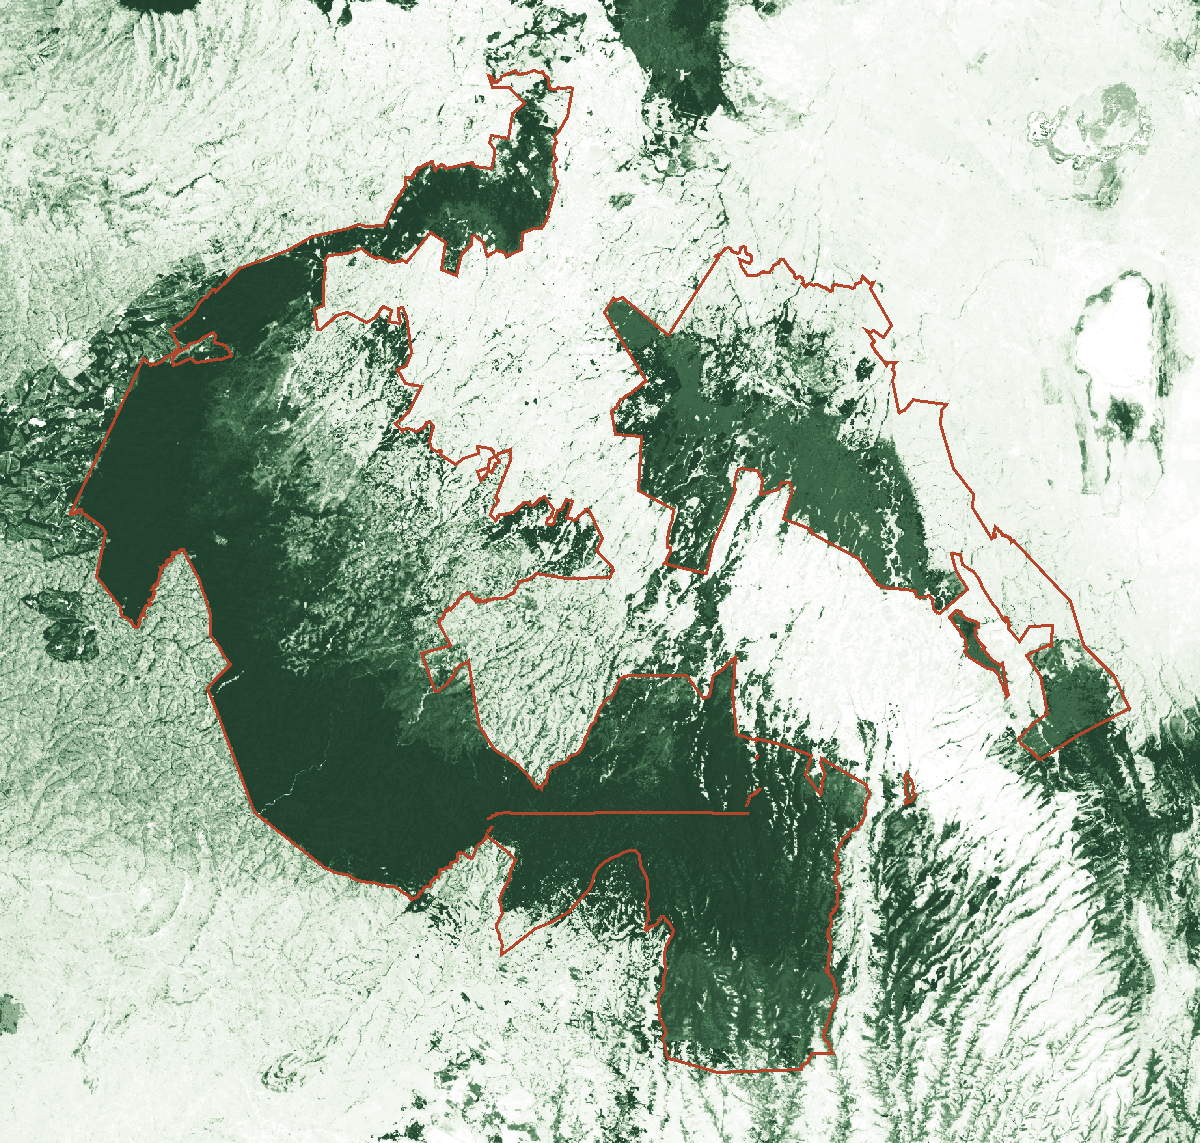
Mau Forest Complex boundary over tree cover
The WDPA-derived boundary of the complex (271,775 ha) drawn over year-2000 tree cover. Dark tones are dense canopy; the red line is the analysis polygon used for every statistic on this page.
Rendered from the project’s Earth Engine exports at the native resolution of each source dataset (30 m Hansen/UMD, 100 m ESA CCI Biomass).
Before and after: 2001 vs 2024
The same extent, at the two ends of the record.
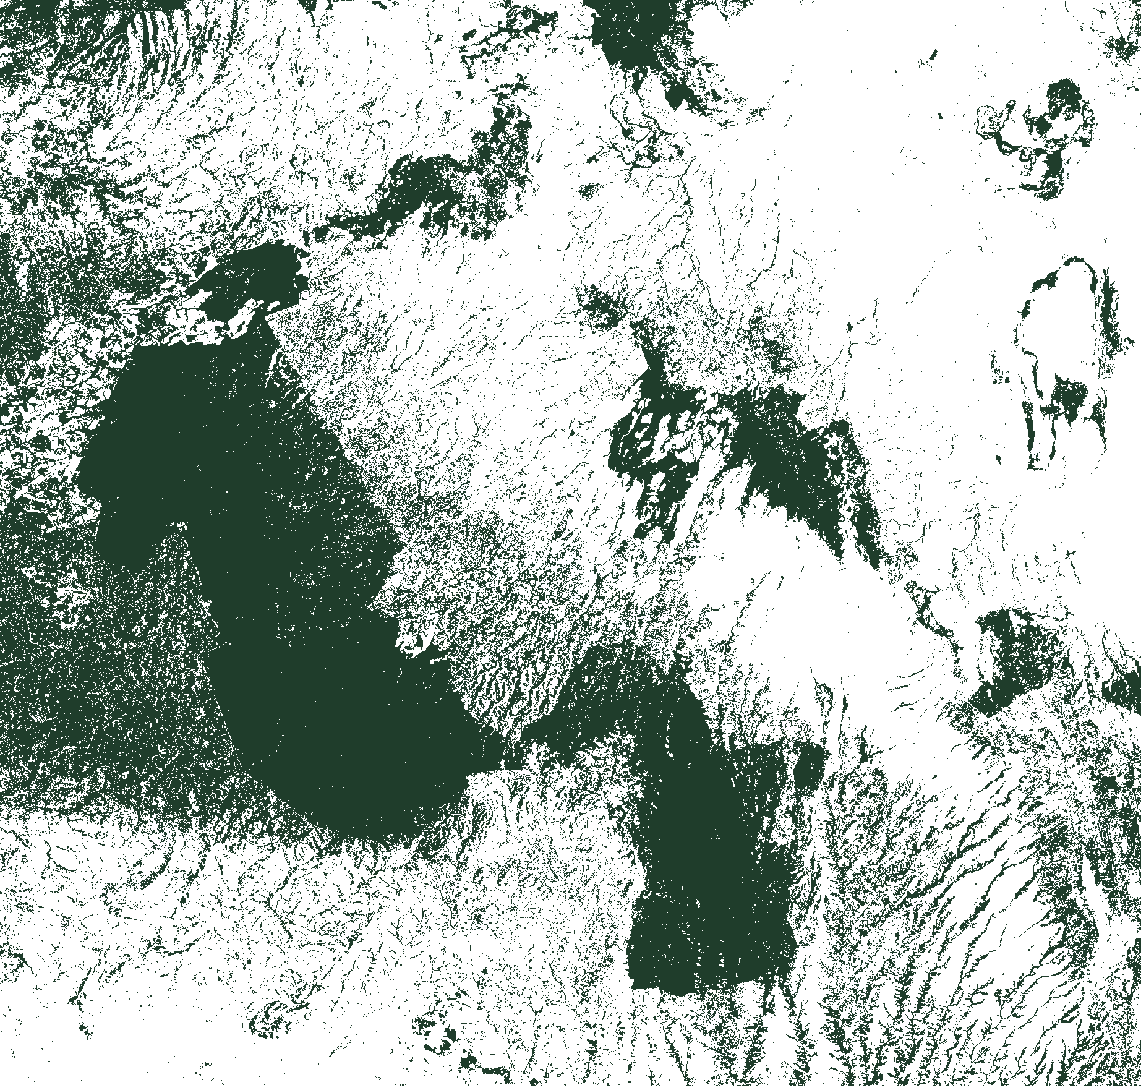
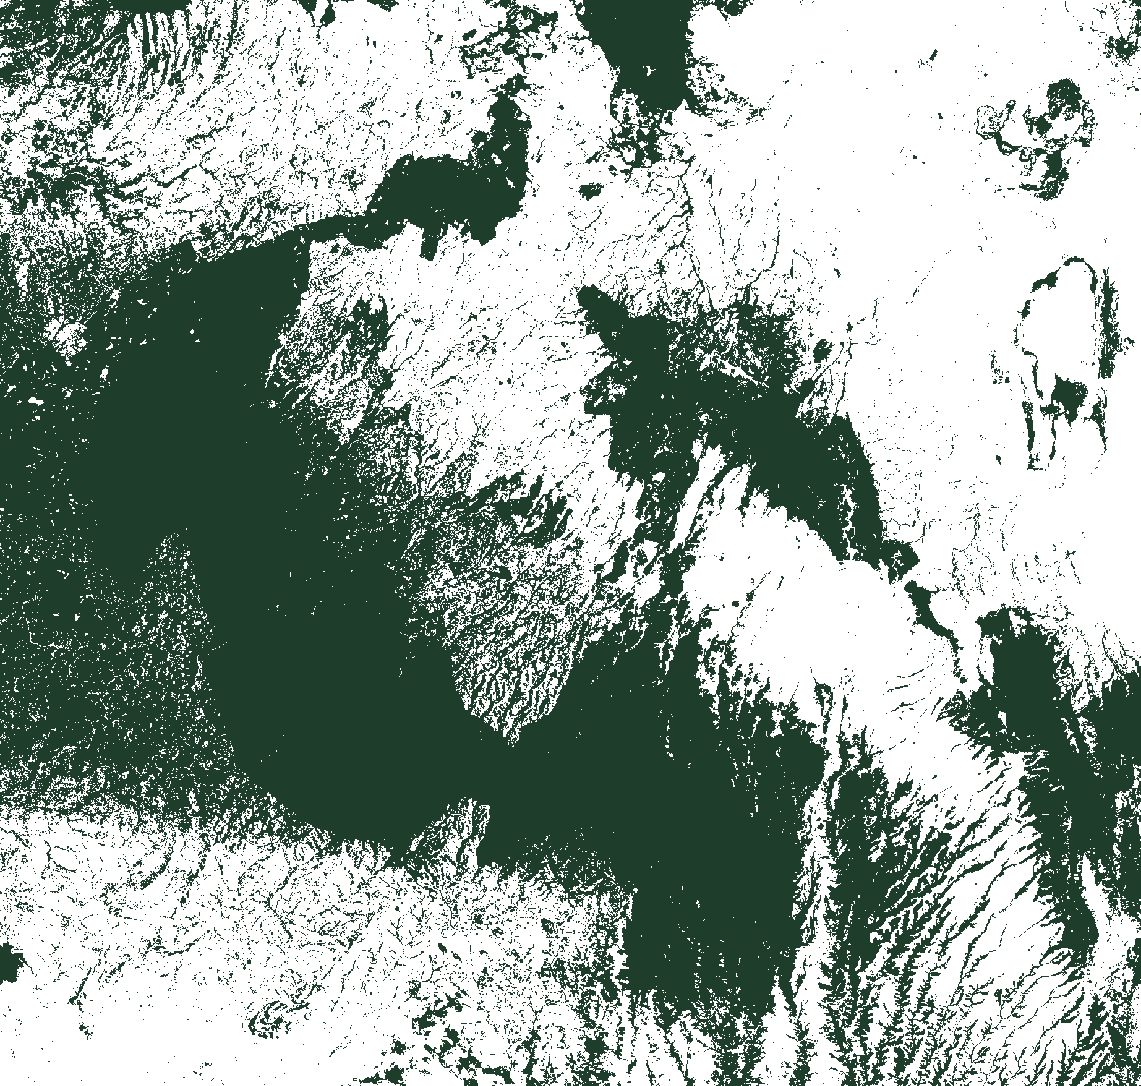
Drag the handle to compare intact canopy at the start of the record with what remains after 24 years. The thinning of the eastern and southern margins is the visual signature of the 41,780 ha quantified in the charts above.
The ideal, the problem, and the gap
Research question & objectives
How has deforestation affected forest carbon stocks in the Mau Forest Complex, and what are the implications for climate change?
- —Assess the spatial and temporal extent of tree cover loss, 2001–2024
- —Estimate above-ground carbon stocks using satellite-derived biomass data
- —Quantify carbon stock loss and CO₂-equivalent emissions from mapped deforestation
- —Identify and rank deforestation hotspots by forest block
- —Evaluate implications for regional and national climate mitigation targets
Study area
East Africa’s largest closed-canopy montane forest, spanning the Kericho, Bomet, Nakuru and Narok county borders — feeding rivers across the Lake Victoria Basin and supporting an estimated 3 million dependent people. The 271,775 ha study boundary is dissolved from WDPA protected-area polygons and falls within 0.6% of the Kenya Forest Service’s own historical estimate of 273,300 ha.
What the numbers mean, together
At first glance, 41,780 ha of tree cover lost against only a -0.38 Mt C carbon change looks contradictory. It isn’t — the two measurements cover different things over different timeframes.
Different time windows
Tree-cover loss is tracked from 2001; carbon stock only from 2007, the earliest available biomass image. Roughly the first third of cumulative loss predates the carbon record.
Loss is not always total clearing
Hansen's dataset flags any drop in canopy — selective logging, thinning, fire — not only total deforestation. Some biomass can remain or partially regrow afterwards.
Restoration ran in parallel
Kenya's Green Zones project replanted roughly 14,000 ha in and around the Mau between 2007 and 2016, likely offsetting some losses within the same window the carbon data covers.
From one forest to the global climate
Local
41,780 ha of canopy lost releases stored carbon and shrinks future sequestration capacity in the Mau Complex.
Regional
Degraded water-tower function weakens river regulation across the Lake Victoria Basin — affecting roughly 3 million people.
National
1.39 Mt CO₂e released works against Kenya's NDC climate commitments and forest-based mitigation targets.
Global
Multiplied across the world's shrinking tropical and montane forests, this is the same mechanism reducing global carbon-sink capacity.
Limitations
- —The area of interest is a strong approximation built from WDPA polygon names, not the official gazetted survey boundary.
- —Hansen tree-cover loss captures any canopy drop above the threshold, including legal forestry rotation — hotspot severity should be read alongside land-use context, not as proof of illegal activity.
- —ESA CCI Biomass is only published for specific years, so carbon stock is interpolated between available years rather than measured annually.
- —Carbon stock coverage begins in 2007, missing roughly a third of the study's cumulative tree-cover loss.
Recommendations
- —Prioritize restoration and enforcement on blocks combining high historical loss with high remaining carbon density.
- —Pair satellite monitoring with periodic field verification in blocks where thinning may be undercounted by tree-cover-loss data alone.
- —Route the annual pipeline output into Kenya's national forest and carbon reporting cycles.
- —Backfill the pre-2007 carbon gap using complementary biomass products as they become available.
Conclusion
This assessment provides a reproducible picture of the Mau Forest Complex’s carbon trajectory: 41,780 hectares of tree cover lost since 2001, and a -0.38 Mt C (1.39 Mt CO₂e) net carbon-stock decline since 2007, on a WDPA-verified 271,775-hectare boundary — built entirely from open satellite data via Google Earth Engine. The same pipeline can be replicated across any forest landscape TerraVisuals is asked to monitor.
Data sources & references
- Hansen, M.C. et al. Global Forest Change, University of Maryland / Google, v1.13.
- ESA Climate Change Initiative: Above-Ground Biomass, V6.0.
- UNEP-WCMC & IUCN: World Database on Protected Areas (WDPA).
- Kenya Forest Service (KFS) and UNEP Mau Forest Complex assessments.
- IPCC default carbon fraction (0.47) and CO₂-equivalent conversion (44/12 molecular ratio).
Datasets queried directly in Google Earth Engine: UMD/hansen/global_forest_change_2025_v1_13, ESA/CCI/Above_Ground_Biomass/V6_0 and WCMC/WDPA/current/polygons. Pipeline in Python (earthengine-api, geemap, geopandas, rasterio); presentation layer in React, Leaflet and Recharts.
How TerraVisuals delivers this
This Mau Forest study is not a one-off analysis. It is a repeatable capability we can apply to any landscape, protected area or land-use programme in Kenya and the wider region.
Automated satellite ingestion
Deforestation and biomass data pulled directly from Hansen/UMD, ESA CCI, and WDPA, with no manual downloads or field survey bottlenecks.
Carbon accounting built in
Every hectare of tree cover loss is translated into carbon-stock change and CO₂-equivalent emissions automatically.
Live, decision-ready dashboards
Interactive maps and timelines that update as new satellite data becomes available.
Reproducible & auditable
Every number traces back to a named dataset and an open script, built to withstand scrutiny from funders, auditors, and the public.
Who this is for
Governments & Forest Agencies
Continuous, defensible monitoring for national forest inventories, NDC reporting, and enforcement prioritization.
NGOs & Conservation Organizations
Evidence for grant reporting and donor accountability, and data to target restoration where it has the greatest carbon impact.
Corporates & Carbon Markets
Verifiable baseline and ongoing monitoring data to support carbon credit projects and ESG disclosure.
Bring this to your landscape
Whether you manage a protected area, run a conservation program, or need verifiable data for a carbon project, we’ll show you exactly what TerraVisuals would surface for your landscape.